
Menu profitability by section
Every section of a menu has its own costs, its own customer and its own way of losing margin. Pick the part of your menu you are worried about and start there.
-
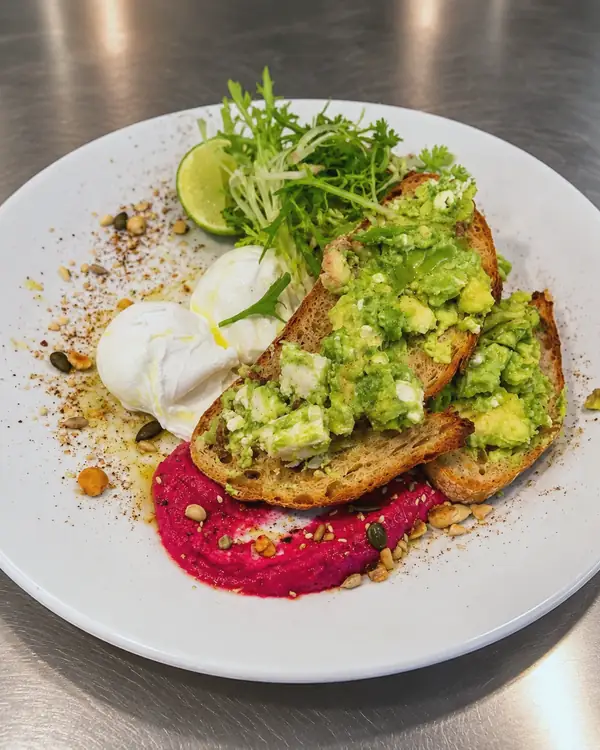
Breakfast menu profitability
Full English, brunch and morning menus. -

Starter menu optimisation
Small plates, appetisers and sharing dishes. -
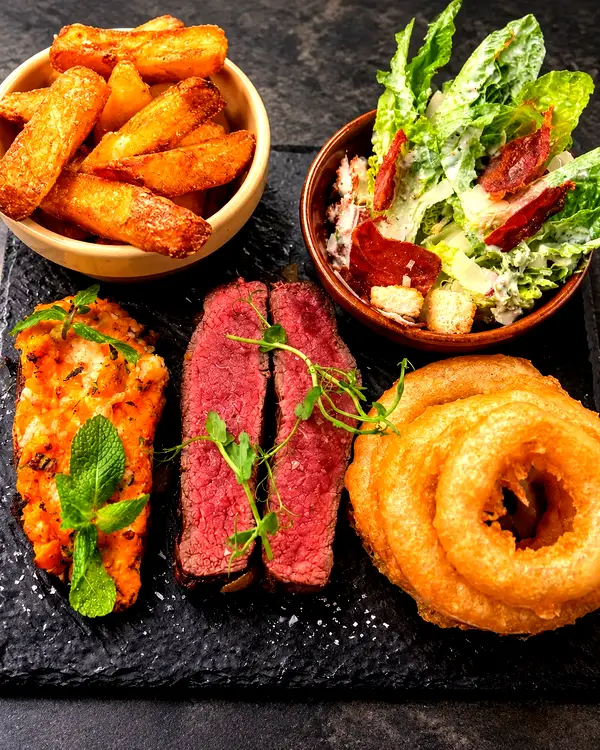
Lunch menu profitability
Sandwiches, salads and light meals. -
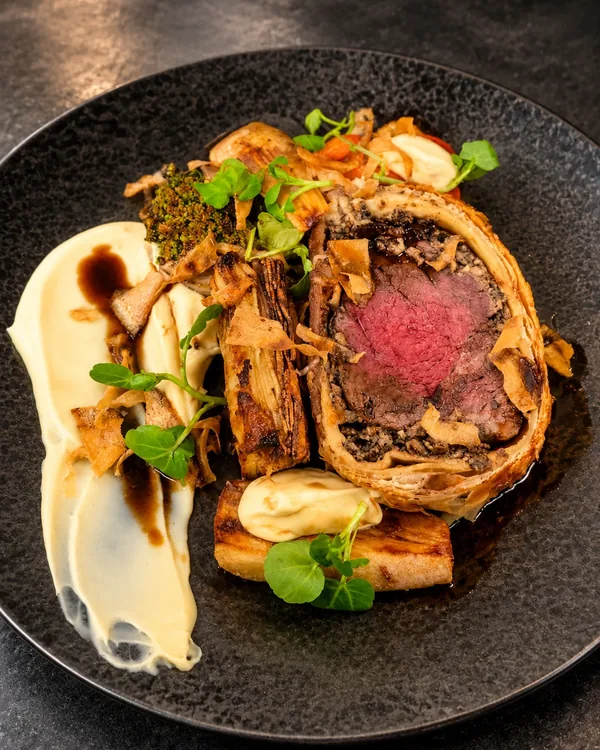
Main course profitability
Restaurant dishes, pub classics and signature plates. -

Dessert menu profitability
Puddings and plated desserts.
What every section is checked against
The sections differ, but the arithmetic underneath is the same, and it is the part most menus get wrong. Every analysis starts from four things.
- Plate cost at usable weight. Costed from current invoices after trim and cooking loss, not the purchase price. How to calculate food cost.
- Gross profit on the net price. UK gross profit is worked after VAT. Working it on the menu price flatters every dish. The GP calculator does it correctly.
- Cash margin as well as percentage. A dish at a lower percentage can return more pounds, and pounds pay the bills. The full menu engineering guide explains how dishes are scored.
- Mix and build time. How often a dish sells, and what it costs the section to send it at pace. What a menu costs in labour.
Where to start
If the whole menu feels off, begin with the main courses, because they carry most of the revenue and most of the cost. If food GP is fine but the kitchen is struggling, look at breakfast and lunch, where build time decides the result. If the average spend per head is flat, look at starters and desserts, where attachment and perceived value do the work.
A menu audit scores every dish across all five sections at once. You can see what that looks like in a sample analysis, or read how the plates on this site were built in the results. Cost a dish yourself with the recipe costing calculator or the food cost calculator, or have the changes made through a menu redesign. Prefer to start from the kind of kitchen? See the sector pages.
Send me your menu
Tell me which dish you think is your weakest. Twenty minutes, and we find out whether you are right.